But First, the Big Fish:
Understanding Concept Maps as Visual Tools of Knowledge Production
and Network Design
“‘Let’s go and swim and play and SEE things!’ [Swimmy] said happily. ‘We can’t,’ said the little red fish. ‘The big fish will eat us all.’ ‘But you can’t just lie there,’ said Swimmy. ‘We must THINK of something.’”
-Leo Lionni, Swimmy (1963)

An illustration depicts a tiny black fish in the open sea. He encourages a school of small red fish to emerge from their hiding spot underneath a coral reef. IMAGE REFERENCE: Leo Lionni. (1963). Swimmy. [illustration]. Random House Inc., New York.
THRESHOLD CONCEPTS:
multimodality (n.): the use of more than one semiotic* mode in meaning-making, communication, and representation generally, or in a specific situation; such modes include all forms of verbal, nonverbal, and contextual communication [1]
kairotic space (n.): contexts in which knowledge is produced and power is exchanged [2]
SUPPORTING CONCEPTS:
*semiotic (adj.): relating to signs and symbols [3]
spatial contiguity (n.): a principle that ascertains the effectiveness of student learning outcomes within materials that spatially order and present corresponding information as near (ie: within close proximity of a perceived space) as opposed to far (ie: as two distinctly perceived spaces) [4]
Click “play” to access an auditory transcription of the following webtext (Part I), as written and read by Rachel Rubino.
In The Journal of Higher Education article “Concept Mapping: Benefits and Challenges in Higher Education” (2020), Cristiane Machado and Ana Carvalho describe concept maps in terms of both their purpose and their construction. They explain how, “concept maps display ideas in a hierarchical structure and tie them together with explanatory nodes and links. Nodes symbolize concepts, and links represent relationships between concepts. Two or more concepts can be linked together with words to form propositions” (38). [5] Machado and Carvalho’s explanation demonstrates how concept maps are made to convey knowledge as an active site: a linkage. In this sense, a concept map illuminates the connective nature of any given branch of information inset a broader corpus of knowledge.
A creator utilizes a concept map as a tool which works to define meaning within a broader, networked structure. The creator’s role may shift, however, as they take up their concept map with the intention of sharing that meaning. As the creator purposes their concept map for an intended audience, they are challenged to think like a designer. Moreover, they are posed to consider how they might render knowledge in an infrastructurally sound—and ultimately accessible—way.
Sascha Schneider et al. allude to this paradigm in their Computers and Education Open article, titled, “How organization highlighting through signaling, spatial contiguity, and segmenting can influence learning with concept maps” (2021). The authors emphasize graphic design as a significant component of purposing concept maps for pedagogical use.
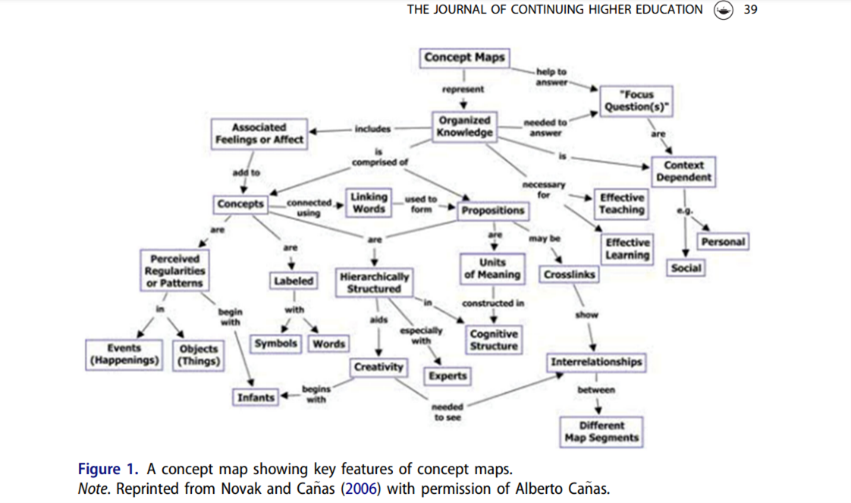
A visual infographic depicts key features of concept maps. The main ideas of this concept map are textually conveyed within different graphical boxes. Lines and arrows portray links and relationships between these distinct nodes of information. IMAGE REFERENCE: Christiane Machado & Ana Carvalho. (2020). Figure 1 [graphic]. The Journal of Higher Education, p. 39.
The visual construction of concept maps prompts an instructor to signal relationships between information in a viable way. Schneider et al. elucidate how,
“in a map with high spatial contiguity (e.g., a concept map, where hierarchies of sub-concepts are graphically visible;), learners can easily track relations between different sub-concepts, which increases the understanding of the whole subject…However, in a map with low spatial proximity, learners could be overwhelmed by the unclear structure of concepts and lines” (2).
In this case, the prototypical model of an effective visual concept map is one that an educator has organized to convey salience between distinct nodes of corresponding information.
Schneider et al. delineate several strategies that teachers can use to effectively create and present concept maps. The most prominent of their design recommendations hails color-coding, a formatting principle that cues “signaling, spatial contiguity and segmenting” to “facilitate learning with concept maps…and make it [overall] easier for learners to understand the internal structure of…concept maps” (13). Knowledgeable of the visual emphasis that concept maps traditionally entail, I began this project with an interest toward tapping into the multimodal affordances of concept maps to expand the range of their use as research tools, and potential as teaching models.

An infographic depicts a coordinate plane with four quadrants. Each quadrant contains a different concept map. The concept maps featured in Quadrants III and IV heavily employ visual design strategies particular to color-coding and segmenting. The comparison between these maps, and the simpler models portrayed in Quadrants I and II, helps demonstrate the principle of spatial contiguity. IMAGE REFERENCE: Sascha Schneider et al. (2021). Fig. 4 [model]. Computers and Education Open, p. 8.
The Oxford English Dictionary defines multimodality as “the use of more than one semiotic mode in meaning-making, communication, and representation.” For example, the Venn Diagram— a concept map model made familiar to students within most elementary to middle school contexts throughout the U.S—is itself a multimodal construct that employs the use of overlapping shapes (e.g., graphic circles) as a means of comparing similarities and contrasting differences between textually conveyed ideas (e.g., written words, phrases, or sentences).
As I dwell on the multimodality of concept maps, I am challenged to think beyond their typical representation as visual models. I am prompted to reimagine concept maps that purpose the multimodal affordances of alternative sensory experiences. How can we implement digital technology to inform accessible pathways for blind and low-vision students to utilize concept maps? Under these circumstances, I query toward the infrastructure of a concept map reimagined: as both a functional tool for research and an instructional asset purposed with an audience-based design.
In the multi-authored webtext Multimodality in Motion (2013), Margaret Price provides a glossary definition for “kairotic space” as the contexts in which “knowledge is produced and power is exchanged.” We can extend Price’s description to rhetorically consider concept maps. This project has thus far evidenced concept maps as vehicles that creators use to produce knowledge. When we conceive of concept maps for their potential as activation sites for kairotic space, we are called to examine the interchange between concept maps and dimensions of power. I recall the multimodality of concept maps as one of its numerous generative aspects. As we consider the concept map for its multimodality, we can begin to discern the knowledge-power relation to which it is wed.
One of Price’s co-authors, Stephanie Kerschbaum, speaks to these deliberations within her webtext-featured essay on “Modality.” As she regards the culture of access within digital environments, she states:
“While many of us celebrate multimodal richness, when considered from a disability perspective, multimodality can be a problem rather than an asset. That is to say, multimodal texts and environments can frustrate participants’ ability to effectively engage within a variety of kairotic spaces…When texts or spaces—including web pages, library resources, and learning environments—are inaccessible, they impact disabled people’s participation in kairotic spaces.”
While traditional models of multimodality have been valuable toward improving accessibility for some users, these models often fall short in addressing the complex range of user needs.
Kerschbaum coins the term “multimodal inhospitality” as a framework for these situational aspects. To elaborate, “multimodal inhospitality occurs when the design and production of multimodal texts and environments persistently ignore access except as a retrofit” (Kerschbaum, 2013). Rather than retrofit a multimodal design to improve access measures, then, creators should work to transform the boundaries of their designs altogether. Kerschbaum advocates that,
“In order to transform the reactive dimensions of providing access, considerations of multimodality should take up how texts are designed as well as how they can be modified by users. Those who design and produce multimodal texts and environments…should enable customization and manipulation of these texts by readers.”
In other words, the exploration of multimodality in digital spaces must encompass the concerns of both design and adaptability. As we evaluate access measures in multimodal contexts, we are presented with an opportunity to reshape the landscape of knowledge and how it is communicated.
The concept map facilitates a fertile site to reflect upon information as it is conceptualized—and ultimately disseminated—on relational terms. I envision a transformative approach to concept mapping, then, as one attuned to sensory perception and the creation of knowledge through touch and sound. Rather than ask, “what would that look like?” I adjust my line of questioning to inquire, “what would that feel and sound like?” and moreover, I wonder, “how would I convey that sound or tactile experience?” I stake a literal interest in Mingus’ framework for transformative access as a means of “build[ing] a political container that access can take place in and be grounded in.” To this end, I contemplate dimensions of knowledge as they are captured and shared through auditory and tactile means.
[1] See “References” for an extended citation of the key term “multimodality, “as defined by Oxford Reference.
[2] This threshold concept is paraphrased from Margaret Price’s glossary definition of “kairotic space” in the webtext Multimodality in Motion (2013). See “References” to access an extended citation of this webtext.
[3] See “References” for an extended citation of the key term “semiotic,” as paraphrased from Oxford Learner’s Dictionaries.
[4] Schneider et al. (see “References”) paraphrase this threshold concept as defined by Harter and Ku in a Computers in Human Behavior article on “The effects of spatial contiguity within computer-based instruction […]”. See “References” to access an extended citation of Harter and Ku’s article.
[5] Machado and Carvalho provide a visual example of the concept mapping process in Figure 1, which is depicted on page 39 of their article.

